Some recent reading of comments on the topic of electric cars has prompted me to summarize my views on where electric cars should be heading next. There is a big disconnect between the reality and the general opinion of people who do not already own an EV. I thought I’d like to shine some light on the discussion, so here goes.
There is nothing magical about the batteries in an electric car. Until about 8 years ago, they used to tend to be large ‘pouch’ batteries, but these days they are more likely to be just an assembly of small round batteries like you stick in a TV remote. The most common is the ‘18650’ batteries used by tesla:
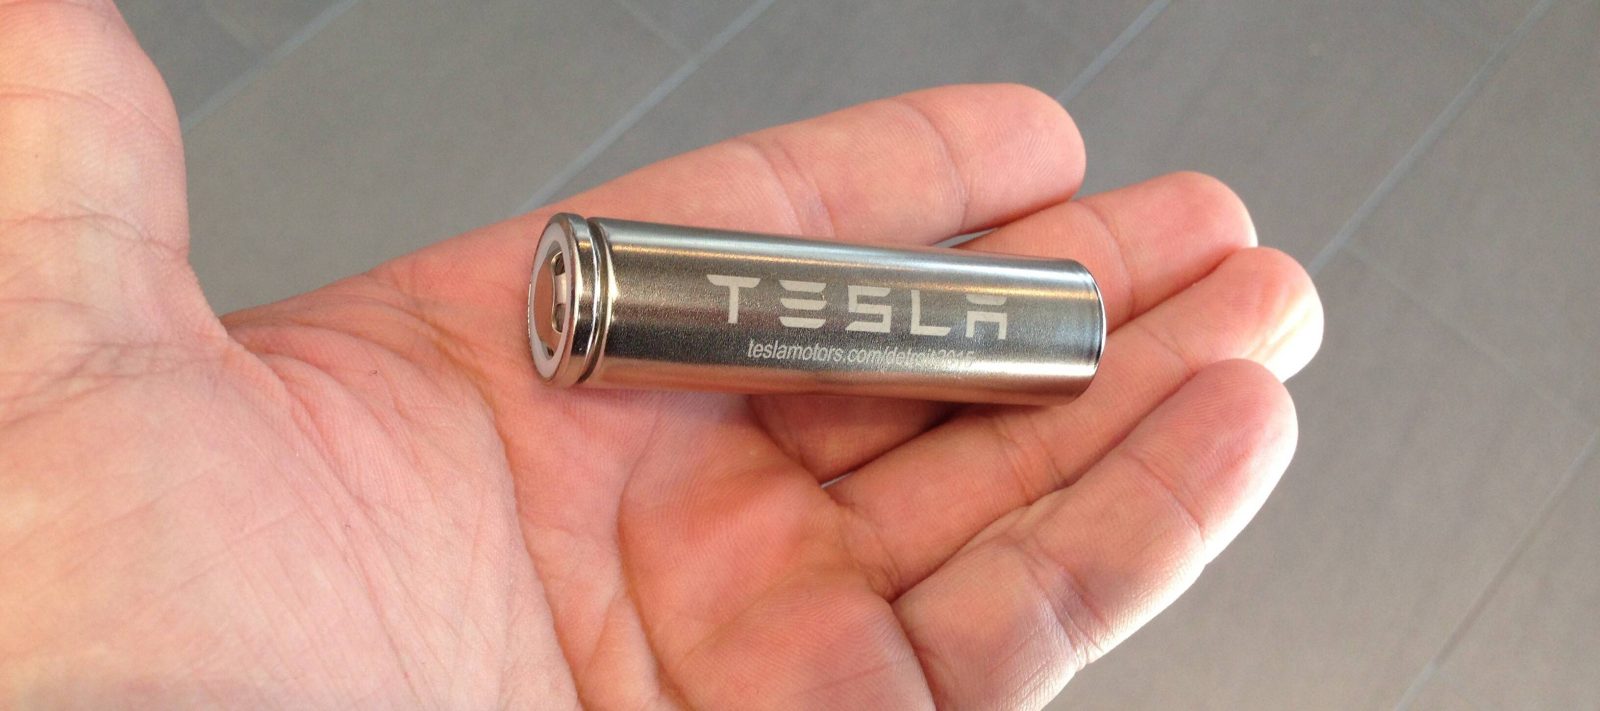
It might sound nuts that this is what powers a car but its true. The difference between that and your laptop/TV remote battery is the ‘battery management system’ meaning some hardware and software that warms/cools/monitors and controls a LOT of these batteries once assembled in a big pack:

When it comes to the battery in an electric car, there are a lot of misconceptions, lies, FUD and confusion about how they work, how good they are, and whats important. This is partly because the battery tech has moved SO FAST, and partly because there are deliberate campaigns by anti-EV lobbyists (oil companies) to spread lies and fear. Lets clear some up!
Firstly, NO they are not dangerous. Stats show that a fossil fuel car is way more likely to catch fire or explode. EV batteries are heavily shielded. One famous case of a tesla battery fire was eventually found to be a result of someones handgun going off whilst pointed at the car floor(battery)…errr…don’t do that! (in ANY car!).
Secondly, no, the batteries do not just die after a few years. Battery degradation is REALLY low. My own car is 4.25 years old, has gone 34,000 miles and the battery degradation is 2.69%. Not only that, but a lot of evidence suggests that they degrade a lot (relatively) the first year, then that rate trickles off. I have no doubt my car battery will last another 50 years minimum (unlike my frail human form)
Thirdly…no, it doesn’t take four hours to charge an electric car at a car charging point. The speed here REALLY depends on the charger itself. My home charger is pretty slow, and will take maybe 10-11 hours from empty to full, but a tesla supercharger will charge insanely faster. The exact empty-full time will depend on temperature, but here is a rough guide:
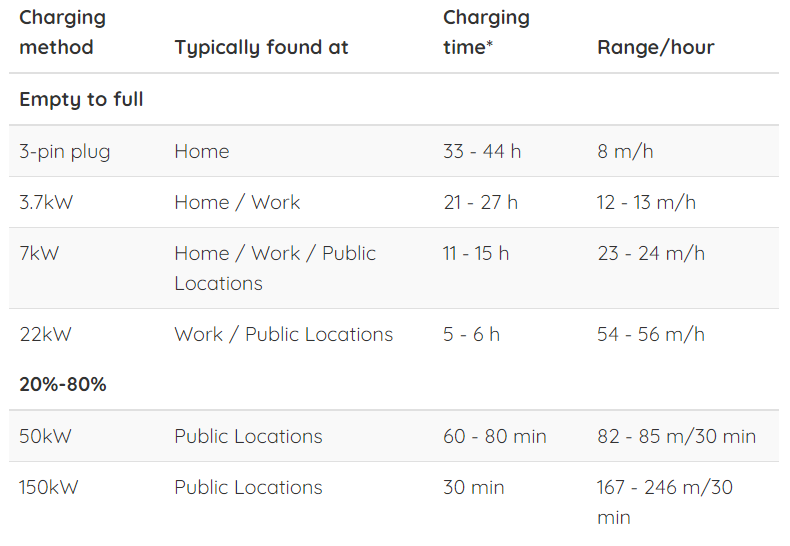
What people forget is that your car charges at home WHILE YOU SLEEP. So 11 hours sounds a lot, but thats then 200-300 miles of range. I don’t travel 200 miles a day on a commute, so I don’t care. Note that not all cars, or chargers are the same. Some older charging networks have really slow speeds, and many cars cannot cope with 150kw. Your Mileage May Vary, but if you think there isn’t a car with 300 mile range that you can ‘fill up’ in 30 mins…well you are wrong :D
Oh and last thing before I talk about trade-offs… the price. I pay about 12p/unit for my electricity (apart from the power I get from my solar panels :D). because I live in COLD England, I average about 350wh/mile in my car, meaning that a mile is using about 4.2p of energy. Not bad
Note that Tesla supercharger prices vary, but are free for many S/X owners. The average rate is about 20-25p/unit. The new ionity chargers are charging 70p/unit so…buyer beware. Its STILL cheaper than petrol though :D
So now lets talk about battery trade-offs, namely the problems of Price, Range, Durability and charging speed.
When designing an EV and its battery these four things are always pulling against each other. Making a stupidly-long-range EV like this 2020 Tesla roadster is easy:
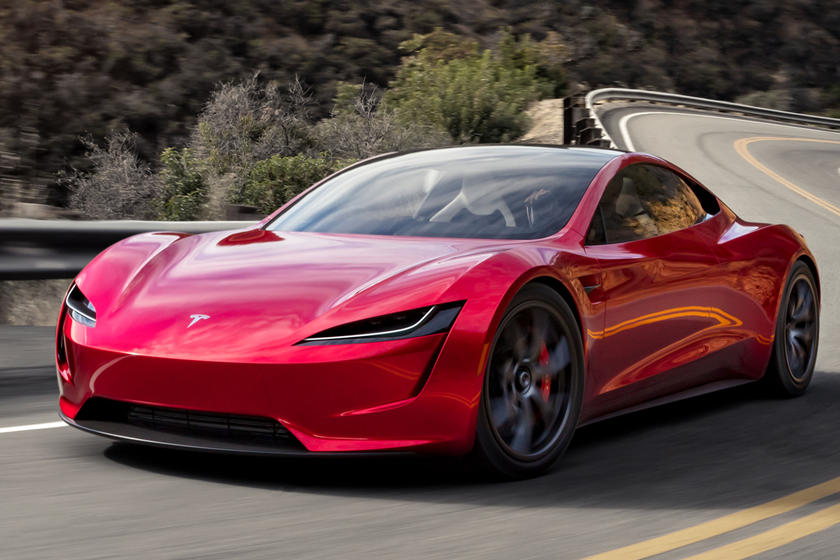
You just layer 2 model S 100kwh packs on top of each other (making the car heavier, and a bit cramped), and enjoy a crazy range of 620 miles. The only downside: OMG its expensive (think £250,000 minimum).
At the other end of the spectrum check out this super cheap electric car, the twizy (Starts at £6,690).

It has an amazing range of…err…56 miles. Not so good. The trade-off there is absolutely to make the cheapest EV possible, but range (as well as performance and interior capacity is totally sacrificed.
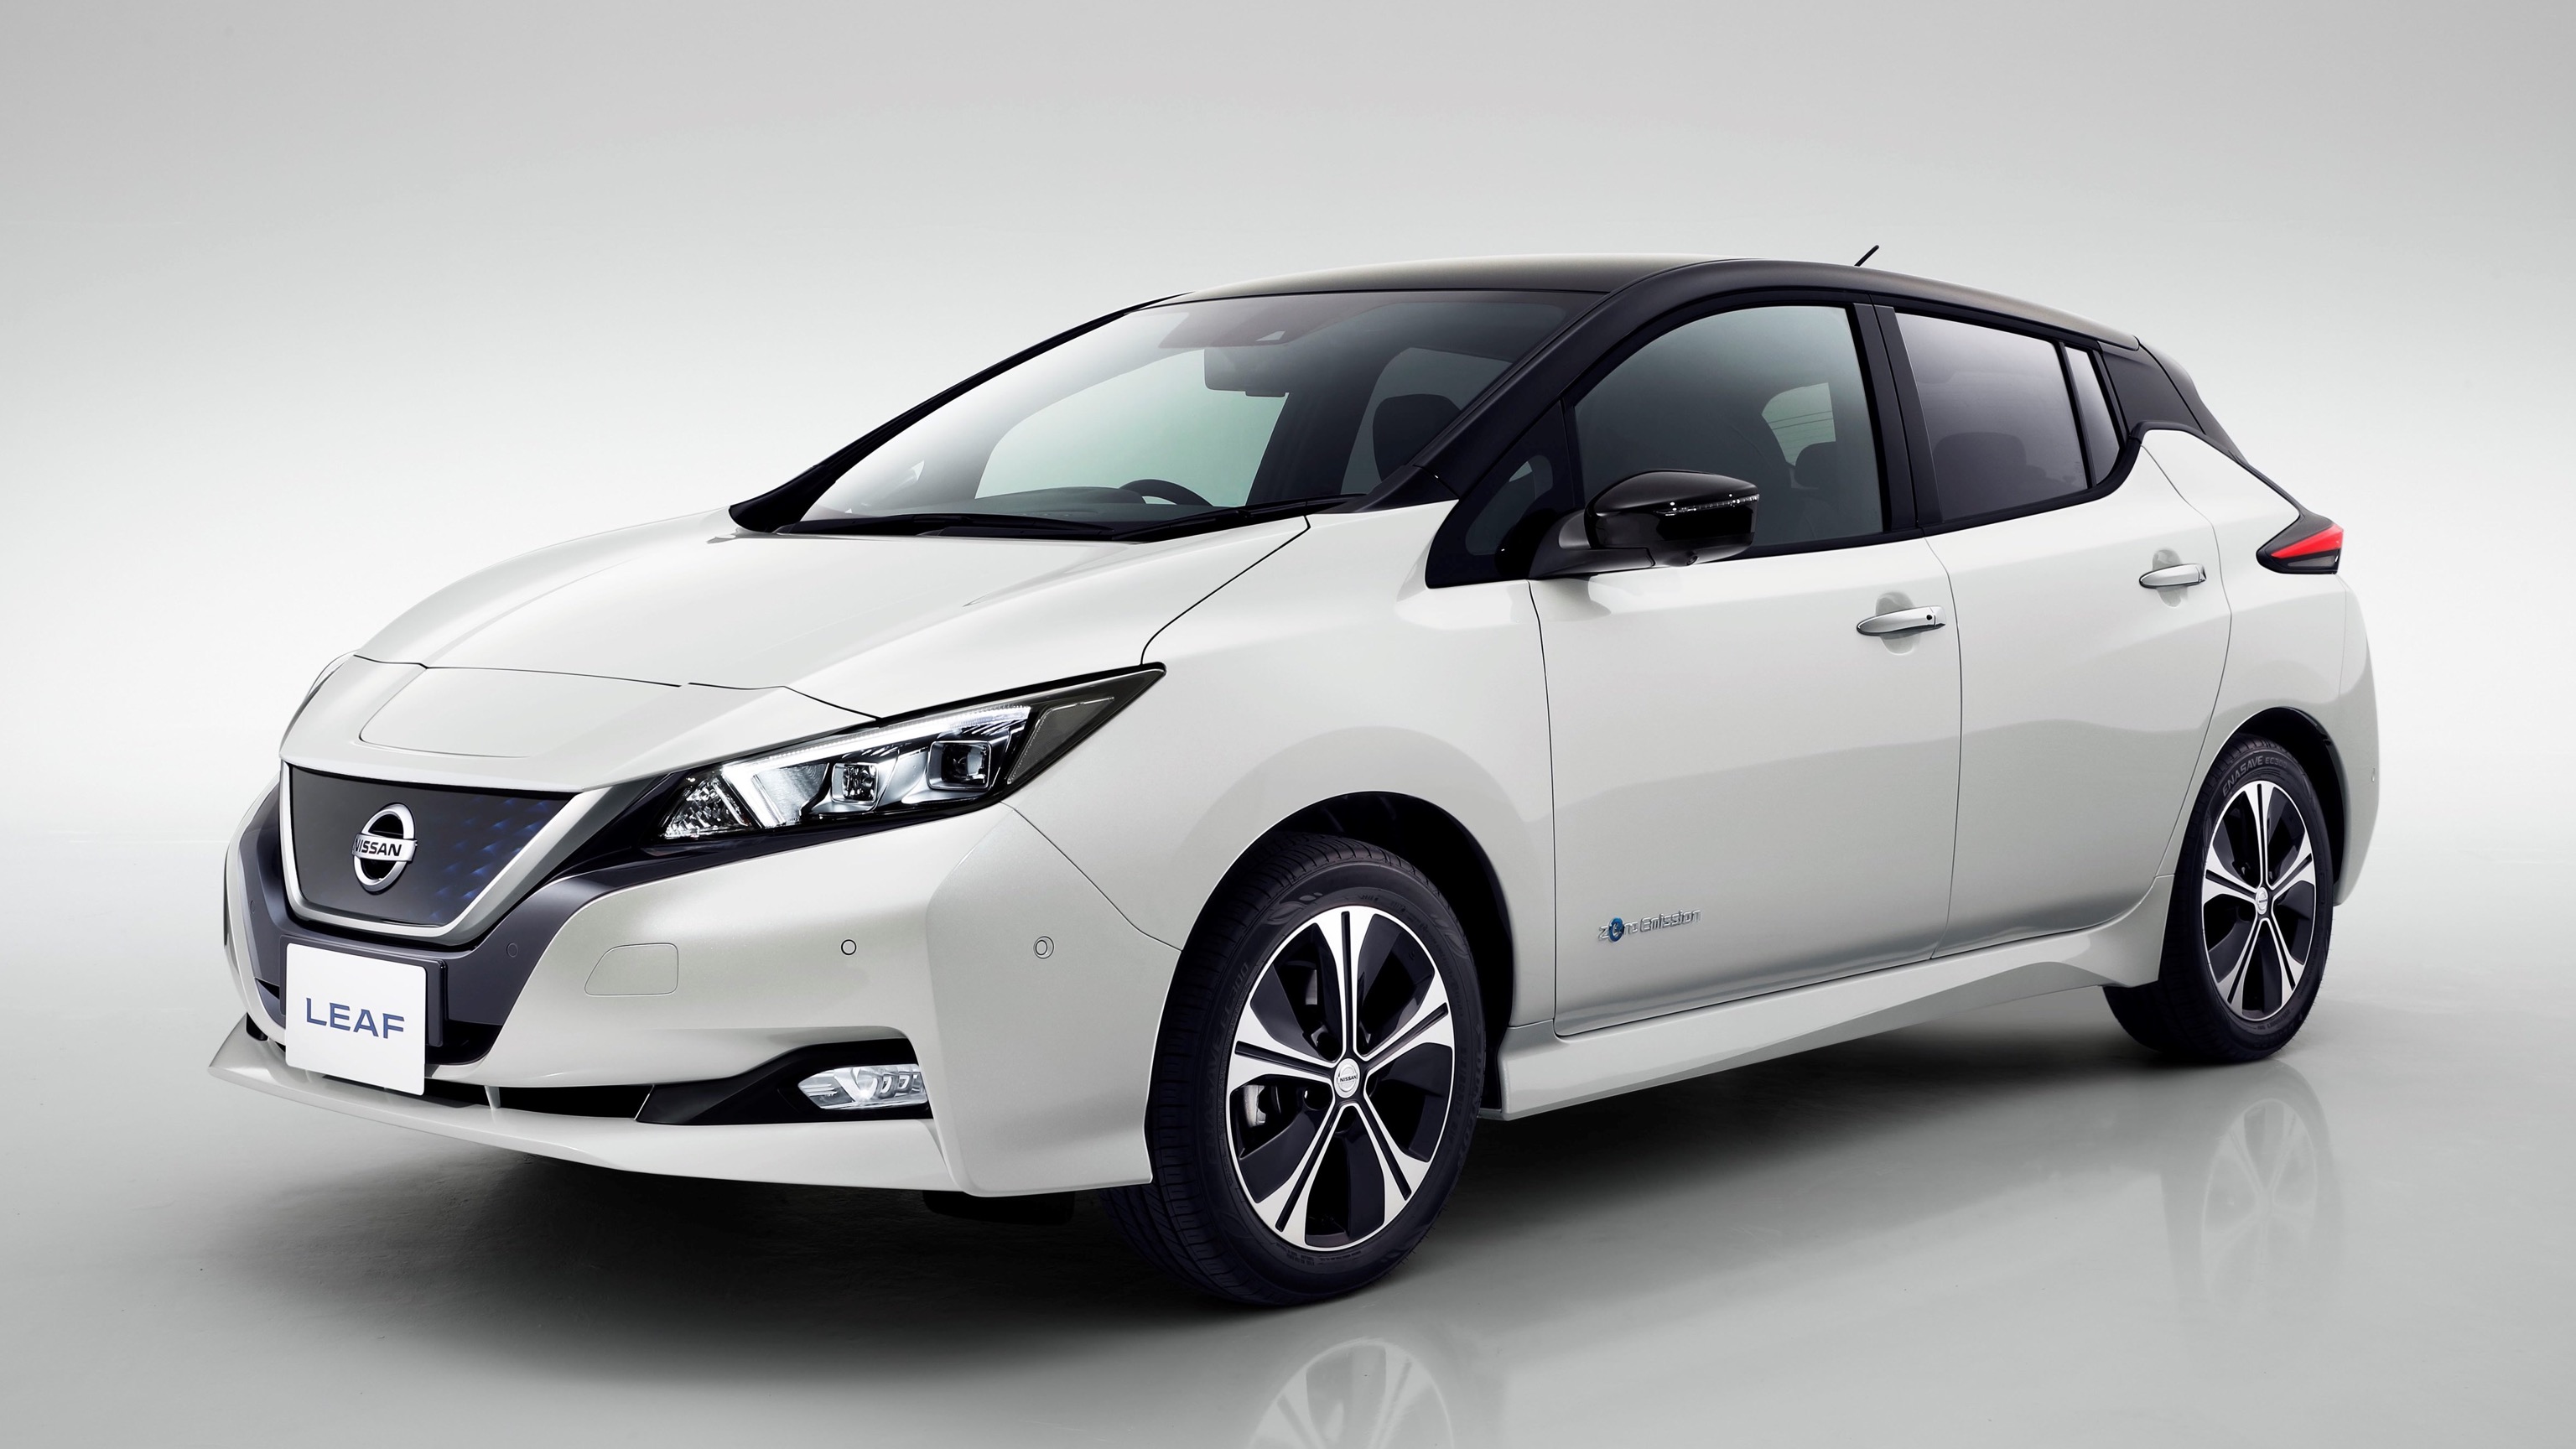
At the less extreme end, here is the Nissan leaf, starting at £26,345. It has a range of 168 miles but is limited to slow 50kw chargers. Its also a bit slow for an EV (max speed 90, 0-62mph 7.9secs).
Essentially all these cars are trying to balance out the priorities of fast charging, long range, price and battery lifetime. Pouring tons of energy into a small battery very fast will affect its lifetime. Having a much bigger battery boosts range *and* allows fast charging, but hugely increases cost. What to do!
My personal opinion? Well I drive a 2015 model S 85D, with an 85kwh battery pack. It can take me comfortably 240 miles, or further if I’m careful and don’t drive like a maniac, or if its super warm and sunny (batteries, like petrol cars prefer warm weather). I would guess 95% of my charging is done at home while I sleep, with me only using a supercharger for long trips ( a quick top up with coffee when I visit london, for example). It seems that most EV drivers you talk to are doing the overwhelming majority of their charging at home or while at work, just like me.
So…
The current best-in-class rate of public charging is about 150kwh. Thats VERY fast., any faster would *actually be annoying*, because the current speed lets me grab a coffee and a bun, and a call of nature before returning to the car. I only need to do this on super-long trips anyway and I WANT a break. Even with autopilot, driving is kinda dull. I want to stop and have a hot beverage.
The speed of filling an EV vs petrol/diesel cars is a HUGE red-herring because unlike most petrol/diesel drivers…we EV drivers hardly EVER need to do this. Its a rare thing for long trips only. If it takes us 15-20 mins, we grab a coffee. You don’t have to sit there holding a pump like those old fashioned petrol cars :D

So for me… NO, speed of charge is now fine. I wouldnt trade anything else to get my EV to charge faster, which leaves range, lifetime, and price.
As I said above, the current battery degradation of my 2015 battery is minimal, and Tesla are now saying they are heading towards a million-mile lifetime battery. In short… this problem is SOLVED. We don’t need batteries that depreciate less, we already have that, AND the charging time thing sorted.
So… that leaves a simple two-axis trade-off between price and range. This is something easily solved by the free market.
Every car in tesla’s lineup comes with a standard and long range variant. You can get a cheap(ish) car with good range, or a pricey car with excellent range. Which you pick is basically a factor of whether you drive a lot of long distances or not, and how much money you have. Its important to note that you should NOT compare your petrol-car range to your EV range. Every time you leave the house you have a ‘full tank’ in an EV. This is a game changer, this is huge!
TBH most of the time (including right now) I don’t even bother plugging my car in at home. Its just parked. I always plug in if I know I’m doing a road-trip the next day, or if its getting low on charge, but its certainly not daily. The range on my car is *more* than sufficient for my needs, even though I live in a rural location and its a 15 mile journey just to go to a shop.

I think eventually people will get over this old-fashioned and silly ‘Until an electric car has 400+ miles range I won’t buy’ trope. Thats thinking like a petrol car. You NEED 400 mile range because refueling is a trip out of your way to some specified location. Thats annoying, and inconvenient, and…old fashioned. EVs make every single house a fuel station.*
So to conclude…I’m thinking the correct trade-off is PRICE. People designing EVs need to focus on price above everything else. EVs are STILL too expensive for many people, and a BIG chunk of the cost is the battery. The industry is already making great progress in this area. The huge scale up between 2012-2020 in terms of EV battery production have sent battery costs down lower and lower, and this should continue to be a point of focus.
So for anyone analyzing the EV market…look at who is making CHEAPER batteries, not the biggest or the ones with the fastest charge rates.
And for anyone looking into getting an EV, ignore battery lifetime and charge rate (these are solved!) and don’t get hung up too much on range either). I follow this market super-closely and would say by a HUGE margin, if you can possibly afford it, the Tesla model 3 is the BEST combination of all these factors.

If you cant afford that, I’d suggest maybe the Nissan Leaf, but that is a big shift down in terms of spec.
If you can’t afford either hang in there…but do NOT buy an expensive hybrid car. Hybrid is the worst of both worlds. Keep your current car struggling along another year or two and watch decent EVs come down in price even more.
*i know this is currently only for houses with offstreet parking, but roadside lampost charging will come soon enough.