Game Design, Programming and running a one-man games business…

You should aim to be the Elon Musk of software

I’m an Elon Musk fanboy, drive a tesla and own tesla stock, I’m a true believer. One of the things I like about the man is the way he does everything in reverse, when it comes to efficiency and optimization. The attitude of most people is

‘This thing runs at 10m/s. How can we make it run at 12 m/s?

Whereas Elon takes the opposite view:

‘Are there any laws of physics that prevent this running at 100,000m/s? if not, how do we get it to do this?’

This is why he makes crazy big predictions and sets insane targets, most of which don’t get met on time, but when they do, its pretty phenomenal. If the next falcon heavy launch recovers the center core too, thats even more game changing, and right now, the estimate is that the falcon heavy launch cost is $90 million verses $400 million of its nearest competitor (which only launches half the weight anyway). That not just beating the competition, but thats bludgeoning them, tying them up, putting them in a boat, pushing the boat out into the middle of the lake, and laughing from the shore during a barbecue as the boat sinks.

When it comes to my favorite topic (car factory efficiency, due to me making the game Production Line), he comes out with even crazier targets.

“I think we are … in terms of the extra velocity of vehicles on the line, it’s probably about, including both X and S, it’s maybe five centimeters per second. This is very slow,” he said. Musk then added he was “confident” Tesla can get a twentyfold increase of that speed.”
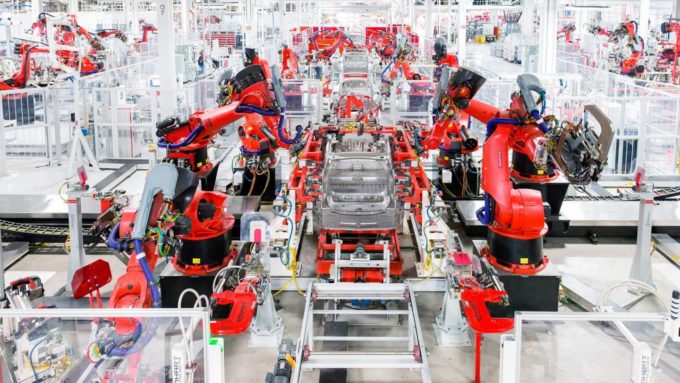
Now we can debate all day long whether the guy is nuts, and over promising and whether or not we could ever, ever get a production line that fast, but you have to admire the ambition. You dont get to create privately-made reusable rockets without ambition. I just wish we had the same sort of drive in software as he has for hardware. The efficiency of modern software is so bad its frankly beyond embarrassing, its shameful, totally and utterly shameful. let me dredge up a few examples for you.

I’m running windows 10, and just launched the calculator app. Its a calculator, this is not rocket science. A glance at task manager shows me that its using up 17.8MB of RAM. I am not kidding, try it for yourself. I’m pretty sure that there was a calculator app for the sinclair ZX-81 with its 1k (yes 1k) of RAM. Sure, the windows 10 app has…err nicer fonts? and the window is very slightly translucent… but 17MB? We need 17MB to do basic maths now? As I type this, firefox has got 1,924MB of RAM assigned to it, and is regularly hitting 2% of my CPU. I’m just typing a blog post, just typing… and thats 2% of a CPU that can do 49,670 MIPS or roughly 50 BILLION instructions per second. Oh…we have slightly nicer fonts too. wahey?

I’d wager the percentage of people coding games who have any real idea how the underlying engine works is tiny, maybe 5%, and of those maybe 1% understand what happens at a lower level. Unity doesn’t talk to your graphics card, it does it through OpenGL or DirectX, and how many of us really understand the entire code path of those DLLS? (I don’t) and of those, how many understand how the video card driver translates those directx calls into actual processor instructions for the card hardware? By the time you filter your code through unity, directx and drivers, the efficiency of what actually happens to the hardware is laughable, LAUGHABLE.
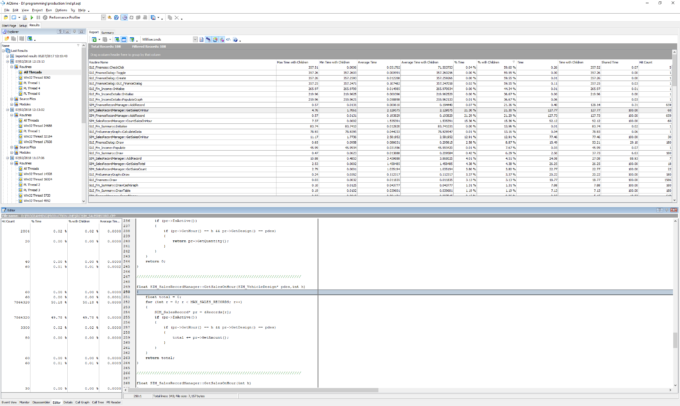
We should aspire to do better, MUCH better. Perhaps the biggest obstacle is that most of us do not even know what our code is DOING. Unless you have a really good profiler, you can easily lose track of what goes on when your game runs, and we likely have zero idea what happens after our instructions leave our code and disappear into the bowels of the O/S or the graphics API. Decent profilers can open your eyes to this stuff, one that can handle displays of each thread and show situations where threads are stuck waiting is even better. Both AMD and nvidia provide us with tools that let us step through the rendering of individual frames to see how each pixel is rendered, then re-rendered and re-rendered many times per frame.

If you want to consider yourself not just a hacker but an ENGINEER, then you owe it to yourself, as a programmer to get familiar with profilers and code analysis tools. Some are free, most are not, but they are a worthy investment. Personally I use AQTime, and occasionally intel XE Amplifier, plus the built-in visual C++ tools (which are a bit ‘meh’ apart from the concurrency visualizer). I also use nvidias nsight tools to keep an eye on graphics performance. None of these tools are perfect, and I am by no means an especially good programmer, but I am at the very least, fully aware that the code I write, despite my efforts, is nowhere REMOTELY close to as efficient as it could be, and that there is plenty of room to do better.  If Production Line currently runs at 60FPS for you (average speed across all players is 58.14) then eventually I should be able to get it so you can play with a factory at least 10x that size for the same frame rate. I just need to keep at it.

I’ll never be the Elon Musk of software, but I’m trying.


Battering the RAM

I had a bug in Production Line recently that made me think. Large factories under certain circumstances (and by large I mean HUGE) would occasionally crash, seemingly randomly. I suspected (as you usually do if you have a large player-base) that this must be the players machines. If code works fine of 99.5% of PCs, and breaks on the remainder…that seems suspicious. Once I managed to get the same save games to crash on mine, again in seemingly weird places, but always near some memory allocation…the cause became obvious.

I had run out of memory.

This might seem crazy to most programmers because memory, as in RAM is effectively unlimited right? 16GB is common, 8GB practically ubiquitous, and in any case windows supports virtual memory, so really we are talking hundreds of gigs potentially. Sure, paging to disk is a performance nightmare…but it shouldn’t just…crash?

Actually it WILL, if you are running a 32 bit program (as opposed to 64 bit) and you exceed 2 GB of RAM for your process.  This has always been the case, I’ve just never coded a game that used anything LIKE that. Cue angry rant from unhinged ‘customer’ who thinks it is something akin to being a Neanderthal that my game is 32 bit. Take a look at your program files folders people…the (x86) is all the 32 bit programs. I bet yours is not empty… 64bit is all well and good, but the majority of code you run on a day-to-day basis is still 32 bit. For the vast majority of programs it really wont matter. For some BIG games, it really does. Clearly a lot of FPS games easily need that RAM.

So the ‘obvious’ solution is just to port my engine and game to 64 bit right?

No.

Not for any backwards compatibility reasons, or any porting problems reasons (although it WOULD be a pain tbh…) but because asking how to raise that 2 GB RAM limit is, to me, completely the wrong question. The correct question is “Why the fuck are we needing over 2GB  of RAM for an indie isometric biz sim anyway?” And it turns out that if you DO ask that question, you solve the problem very quickly, very easily, and with a great deal of pride and satisfaction.

So what was the cause? and how was it fixed? Its actually quite surprising. Every ‘vehicle’ in the game code has a GUI representation. Because the cars are built from a number of layers, they are not simple sprites, but actually an array of sprites. The current limit is 34 layers (some layers have 2 sub-layers, for colored and non-colored), from axles to drive shafts to front and rear doors, windows, wing mirrors, headlights, exhausts and so on. Every car in the game may be drawn at any time, so they all need a GUI representation. The game supports 4 directions (isometric), so it turns out we need 34 layers X 2 sub-layers X 4 directions = 272 sprites per car. Each sprite needs 4 verts and a texture pointer (and some other management fluff). Call it 184 bytes per sprite, that means the memory requirements for any car amount to 50k per car. If the player has been over-producing and has 6,000 cars in the showroom then this suddenly amounts to 300MB just of car layer data.

So that explains where a lot of the memory comes from…but what can I do about it? I’m not stupid enough to DRAW all these all the time BTW, I cache them into a sprite sheet and when zoomed out I use that for single-draw-call splats of a whole car, but for when zoomed in, or when the sprite sheet is full, I still need them, and I need them to be there to fill the sprite sheet mid-game anyway. How did I reduce the memory requirements so much?

Basically I realized that although SOME vehicle components (car doors etc) had 2 layers, the vast majority did not. I was allocating memory for secondary layers that would never be rendered. I simply reorganized the code so that the second layer was just a NULL pointer which was allocated only if needed, saving myself the majority of that RAM. With my optimizing hat on, I also found a fair few other places in the code where I have been using ints instead of shorts (like the hour member of a sales record) and wasting a bunch more RAM. Eventually I ended up knocking something like 700MB of RAM in the largest, worst cases.

Now my point is… if I had just taken the attitude of many *modern* coders and thought ‘ha! what a dick! lets allow for > 2GB memory’ rather than thinking about exactly how the amount had crept up so much, I would never have discovered my own silliness, or made the clearly sensible optimization. Lower memory use is always good, as long as there isn’t a major CPU impact. More vehicle components can now fit into the cache, and be processed quicker. I’ve sped up the games performance as well as reducing its RAM hunger.

Constraints are good. If you have never, ever given any thought to how much RAM your game is using, you really should. It can be eye-opening.


The big Production Line performance issue: route-finding

Unlike a game its often compared to (factorio), Production Line has intelligent routing. In factorio, things on conveyor belts go in the direction you send them without thought as to if thats the right way. In Production Line, every object has intelligence, and will pick the best route from its current location to its desired location, which allows for some really cool layouts. It is also a performance nightmare.

Obviously every time the game creates a new axle, wheel, airbag or other component, we dont want to calculate a new route along all the overhead conveyors. Thats madness, so we cache a whole bunch of routes. Also, when we decide which resource importer should be assigned with (for example) airbags, we dont want to do a comparison of routes over every possible combination, so we also cache the location of the nearest 2 import bays. Once we have worked out the nearest 2 bays, we never EVER have to recalculate them unless a bay is added, deleted, or a piece of the conveyor network is added or deleted. So thats cool.

The problem is, this happens ALL THE TIME, and its a big part of gameplay. If we have, for example 100 production line slots, and 20 import bays, then we need those 100 slots to check 20 routes each, every time we change anything related to the resource network. Thats 2,000 route calculations per change. if the player is slapping down one every 3 seconds, then thats 600 routes per second, so ten routes a frame, which isn’t *that bad*.

If the map is bigger and we have 200 slots and 40 bays, then suddenly its 40 routes per frame that need calculating. Very quickly you end up with profiling data (multithreaded) like this:

There are multiple solutions that occur to me. One of them is to spread out the re-calculation over more frames, which means that the import location could be sub-optimal for a second or two longer (hardly a catastrophe). Another would be to do some clever code that works out partial routes and re-uses them as well. (If my neighbour is 1 tile away and his routes are optimal, and I have only one possible path from me to him…calculating new routes entirely is madness).

In any case, I have some actual proper bugs relating to routes *not* being calculated, which is obviously the priority, but I need to improve on this system, as it is by far the biggest cause of performance issues. FWIW, it only happens on really super-full large maps, and custom maps, but its still annoying… Eventually I’ll find a really easy fix and feel like an idiot.

Meanwhile Production Line was updated to build 1.38, with loads of cool improvements. Hope you like it.

Coding post: Prop pre-draw optimizing. Thinking aloud.

Typing out my thoughts often helps.

Production Line has lots of ‘props’ (like a robot, a filing cabinet, a pallet, a car window…). They could all be anywhere on screen. They are however, all rendered in a certain tile. I know with absolute certainty if a tile is onscreen.

Before actually rendering each prop, I ‘pre-draw’ it, which basically means transform and scale it into screen space. I do this on the CPU (don’t ask). To make it fast, I split all the tiles into 16 different lists, and hand over 16 tasks to the thread manager. In an 8 thread (8 core) setup, I’m processing 8 props at once. I allocate the props sequentially, so prop 1 is in list 1, prop 2 is in list 2, and looping around so i have perfect thread balancing.

Its still too slow :(

Obviously given the tile information, I can just ‘not transform’ any prop that is in a tile that is known to be offscreen. I already reject this early:

void GUI_Prop::PreDraw()
{
if (!PTile->IsOnscreen() && FallOffset == 0)
{
return;
}

But the problem is I’ve already made the function call at this point (waste of time) and checked IsOnscreen (a simple bool…but still…). Ideally this call would never happen. A tile that is a stockpile with 16 pallets and 16 door panels on it has 32 props. Thats 32 pointless function calls. Clearly I need to re-engineer things so that I only bother with this code for props that actually are in a tile thats onscreen. That means my current system of just allocating them to 16 lists in a roundrobin fashion sucks.

One immediate idea is to allocate them not as props at all, but as tiles. That means my proplists would be a list of props (each of which can iterate their tiles) and means at draw time, I’m only checking that PTile->IsOnscreen once per tile, rather than up to 32 times. One problem here is that a LOT of tiles have no props at all, but I can fix that by only adding tiles to the list the first time a prop is added to a tile. To be really robust, I’d have to then spot when a tile was clear of props and call some ‘slow but rare’ code which purges it from the appropriate prop list. That can be done in some low priority code run during ‘free’ time anyway.

I’m going to undertake a switch to this system (its no minor 20 minute feat of engineering) and then report back :D


Ok…

well I *think this increased speed by about 50-80% but its really hard to be sure. I need to code some testbed environment which loads a save game, then spends X seconds at various locations and camera positions in order to have reproducible data. The speedup depends vastly on the zoom level, because its basically saving a lot of time when a LOT of the factory is offscreen, but introduces maybe some slight overhead in other circumstances, because there are now 2 layers of lists to iterate. the tiles and then props-within-a-tile. When zoomed in, thats still vastly fewer function calls.

Also it really depends on the current code bottleneck. The code is multithreaded, so potentially 16 of these lists are being run at once. If the main thread was dithering waiting for these threads to complete, this speeds things up, else nothing is gained. My threadmanager hands tasks to the main thread while its waiting so hopefully this isn’t a concern. I shall await feedback on the next builds performance with interest.


Getting threads to rapidly schedule tasks in C++, Windows

very techy post…

My latest game uses the same multi-threading code I’ve used before. This is C++ code under windows, on windows 10, using Visual Studio 2013 update 5. My multithreading code basically does this:

Create 8 threads (if an 8 core system). Create 8 events which are tracked by the 8 threads. At the start of the app all of the threads are running, all of the events are unset. As I get to a point where I wwant to doi some multithreaded code, i add tasks to my thread manager, and when I add them, I see which of my threads does not have a task scheduled, and I set that event:

PCurrentTasks[t] = pitem;
SetEvent(StartEvent[t]);

Thats done inside a CriticalSection, which I initialized with a spincount of 0 (although a 2,000 spiun count makes no difference).

Each of the threads has a threadprocess thats essentially this:

WaitForSingleObject(SIM_GetThreadManager()->StartEvent[thread], INFINITE);

When I get past that, I enter the critical section, grab the task assigned to me, do the actual thread work, then I immediately check to see if there is another task (again, this happens in a critical section). if so…I process that task, if not, I’m back in my loop of WaitForSingleObject().

Everything works just fine… BUT!

If I have a big queue of things to do, my concurrency charts from vtune show stuff like this:

Seriously, WTF is happening there? Those gaps are huge, according to the scale they are maybe 0.2ms long. What the hell is taking so long? Is there some fundamental problem with how I am multithreading using events? Does SetEvent() take a billion years to actually process? If feels like my code should be way more bunched up than it is.