I thought I might try another of those ‘live blog’ entries where I go through my thought processes as I do some code profiling to speedup the route-finding slowdowns on super-huge Production Line factories. Here is the map I’m analyzing usage on.
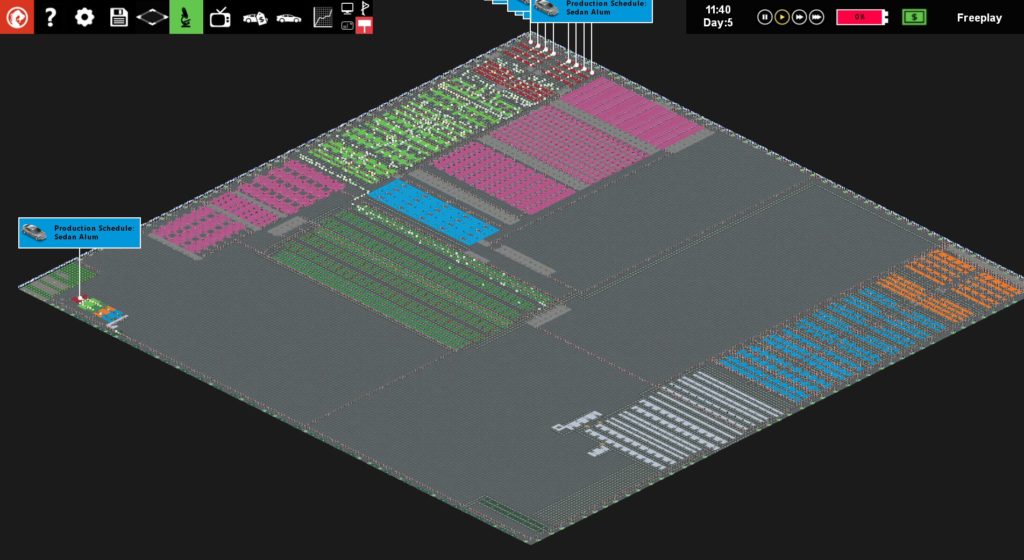
I’m loading the map, waiting 20 seconds, then making a change to the resource route layout, then letting it run another 20 seconds, and taking a look at the function level profiling snapshot using aqtime. This save gamne has 8,994 slots in it (which is massive) and uses a custom map.
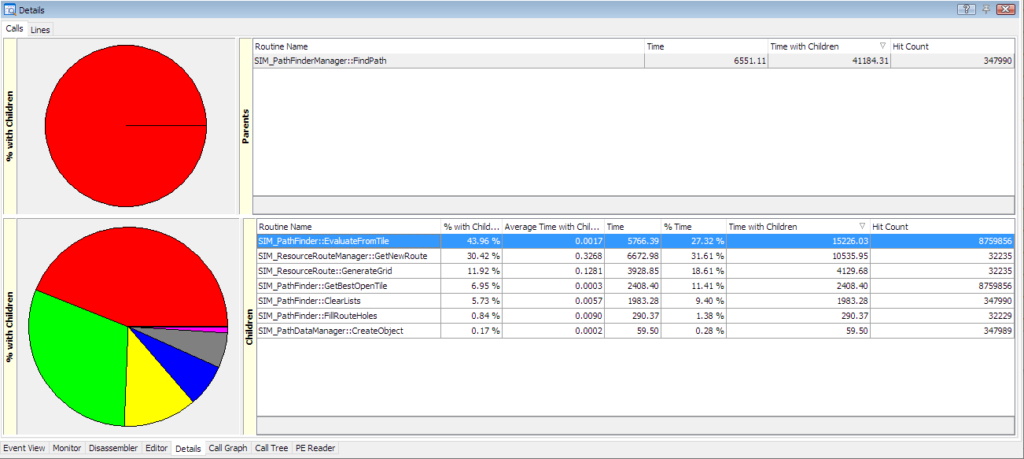
Here is the function breakdown for the GeneratePath() code which seems to be a major cause of any framerate issues when changing routes:
I probably need a refresher in my mind as to how this code works so… Lets look at when I change a route by (for example) placing down a new conveyor. This makes the following calls:
			SIM_GetResourceConveyors()->RefreshExits();
			SIM_GetResourcesRoutes()->PurgeAllImpossible();
			SIM_GetResourcesRoutes()->InvalidateRoutes();
			SIM_GetResourceObjects()->OnRouteAddition();
RefreshExits is trivial, taking on average 0.002ms, so not a problem, PurgeAllImpossible() doesnt show up in the profiler, but it basically sets a lot of flags to be false, and calls a sub function that also is presumably too quick to show up, so likely not a culprit.
InvalidateRoutes() is likely the culprit. It tells every slot, and every stockpile that it needs to begin verifying its current cached route table in case something has changed.
Finally OnRouteAddition goes through every intransit resource object and tells them they need to verify their route(over the next two seconds) in case a newer route is available, or the current one just got deleted. This is also too quick to show up.
So it looks like all that route invalidation is the slowdown. But why? The actual function takes 0.2ms, which is slowish…but not noticeable when a frame is 16.0 ms. Its the delay over the next few seconds that causes the problems… Basically every slot with a stockpile calls PrepareToVerifyBays()…
void SIM_PlaceableSlot::PrepareToVerifyBays()
{
	BayVerificationPending = true;
	int limit = BAY_VERIFICATION_INTERVAL;
	if (APP_GetPerformance()->DoRoutesLimitFramerate())
	{
		limit *= 2;
	}
	BayVerificationTimer = GRandom::RandomChoice(limit);
}
So in English, this code tells the slot that it needs to verify its nearest import bays, and to do so at some random time over the next 60 frames (1 second). A globally calculated value works out if we have a poor framerate, and if we are verifying bays, and thus notes that given this PC, this map etc…we need to allocate twice as much time as usual (4 seconds) to verify those bays…
Thus we have maybe 4 seconds max (4,000ms) over which to spread the effect of all this route re-calculation. That might mean up to 4 seconds of lag, which may seem a short time, but if you are watching a resource item getting delivered in the game, and it travels down the wrong route for more than four seconds…you would be perplexed, so its a reasonable target. How to make it faster?
Bays are verified every frame. a check happens every frame to see if a verification is pending, and if it is, a function gets called. That function is pretty huge and its called SIM_ProductionSlot::RecalculateNearestBay(). In my profiled sample it was called 2,200 times and on average takes 2.8ms. OH MY GOD. Almost all that time is spent inside SIM_ResourceConveyorManager::GetNearestBays(). This function itself does some fancy multithreading, spinning off taks to a lot of threads (8 on my PC) each of which processes a list of routes, eventually calling SIM_PathFinderManager::FindPath(). This gets complex so lets look at a multithreaded analysis of it in vtune:
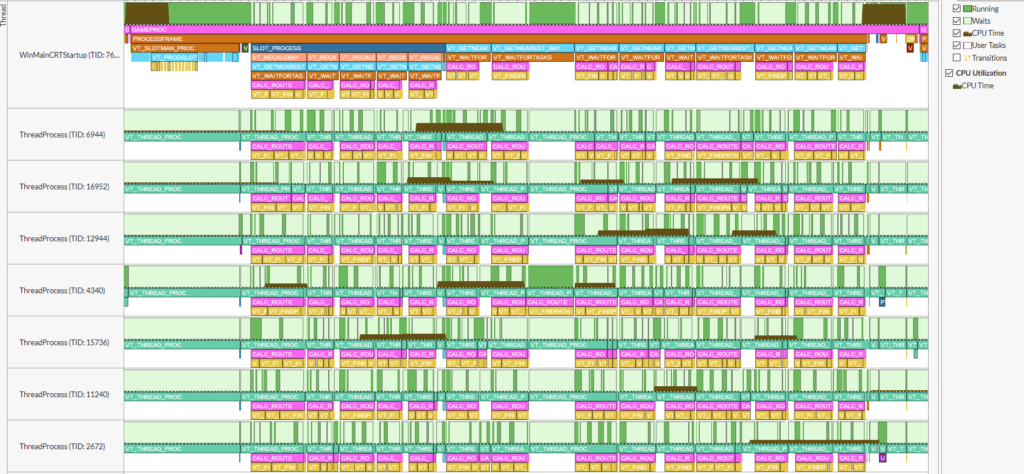
This actually looks pretty efficient and packed, so i think that the real answer to speeding this up is not speeding up the actual route-verification, but culling the cases in which I actually even bother verifying a route. For example…Here is a simple map with production slot stockpiles at A and D, and import bays at B,C,E,F…

Both A and D keep a track of the shortest route along conveyor belts to the 2 nearest import bays. Note not every tile is a route, only each one marked with conveyors, so we have the following.

Now lets say I add a new conveyor belt tile to improve the routing from A to its two nearest bays…

Now as mere humans, its pretty clear to us that as soon as possible, we need to get A to recalculate those two routes it has to its nearest bays, because there is now a shorter route from A to B (but actually not C). Its also pretty clear that D’s routes (to E and F) are totally unaffected. Right now… my algorithm is dumb as fuck, because it tells A and D ‘OMG something changed! redo everything!’, which is a massive waste of resources. The problem is…How exactly does a better algorithm look?
This is one of those things that sounds simple but actually is not. If I learned computer science at school I’d likely be better at this, but I’m self taught. Here is my current thought process:
The route from D to E is 4 tiles. The distance from D to the new tile (pointed at by the arrow) is greater than 4. Thus there is NO way that my route from D to E can possibly be affected by this change. Thus I can leave D as a slot that keeps its old fashioned routes.
So an algorithm that made this optimization would be something like:
For Each Slot
bool bcheck = false
int max_dist_bay = GetMaxDistToBay()
For Each changed tile
If CrudeDistanceToTile <= max_dist_bay
bcheck = true
So its worth trying to see if that helps…
…And I tried it! I even wrote some debug output to verify that the number of slots that got verified each time was below 100%. Something I didn’t realize was that obviously for changes taking place right in the middle of a map, the majority of the map ends up being covered by this algorithm, as the distance for slots to the center of the map is often about the same as the distance to the nearest importer. However, when making changes nearer the edges and corners of the map, a way smaller percentage of the slots need verifying, sometimes just 2-4% of them.
Even if I just assume that we average 50% of slots being verified instead of 100%, this represents a 2x speedup in the game during these events, which should be super noticeable. Of course the only way to be sure this feeds through to user experience is to stick the new algorithm on a togglable switch and watch the frame rate counter and…
YES
It boost the framerate a LOT. Obviously its still spread out over the same amount of time, but the total amount of recalculating needed is way lower so… obviously we get a big framerate boost.
This is NOT a perfect optimised way to do it, but you can bet its already roughly twice as fast, which is great. I need a better way to work out what slots are needlessly recalculating, AND I need to ensure I can use similar techniques on situations that cause a recalc by other means, such as when stuff is deleted but…its definite progress.
I’ll probably work on the deletion case tomorrow, do some more extensive testing, then try it out in the 1.80 preview build (unstable beta) on steam.