Game Design, Programming and running a one-man games business…

Draw list sorting and concurrency issues

Background: I use directx9 to develop Gratuitous Space Battles 2 using my own engine.

I’ve been doing my best to reduce the number of draw calls per frame for complex scenes in GSB2. Basically I have a lot of stuff with different textures and render states, and they are being drawn from front to back rather than z-buffer sorted (for reasons concerning sprites & high quality alpha blended edges).  What this means is, when you have 16 identical laser beam turrets, you may not be able to draw them as a single batch, because in-between them you might be drawing other stuff. As a result you get 16 draws instead of one. Ouch. That causes driver slowdown, directx slowdown, and inefficiency on the GPU, which prefers big batches.

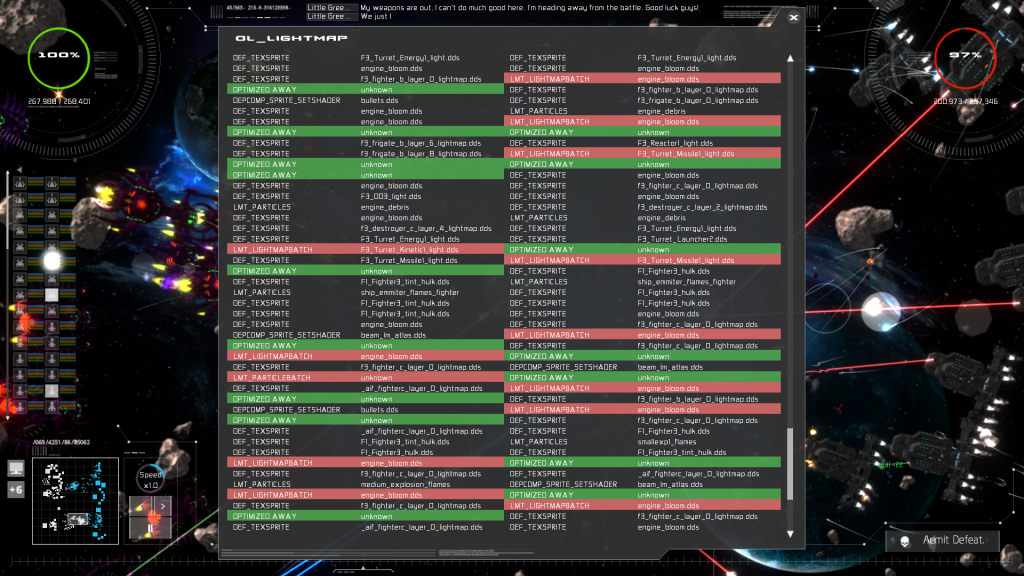
Of course you can immediately see that it would be fine to go through the draw list (one of several actually, for composition reasons), and spot all those cases where you have 2 or more turrets (or any sprite) that use the same texture and which do NOT have anything in between them that overlaps the first one, and grab that second turret and draw it ‘early’ with the other one. And in fact, that works just fine. suddenly lots of draw calls get optimized away! (the green ones) In this case out  1,159 draw calls 713 get optimized away into batches.

megabatchedThere is an immediate problem though. This is extremely slow, even with every optimization trick in the book. Assume you have a list of 1,000 objects to draw (not inconceivable for big battles). In the worst case situation, that means comparing object 1 to 999 different others and doing a bounds check. Then object 2 gets compared to 998, then 3 to 997, and so on. That is a LOT of function calls (inlineable I know…), and a lot of bounding box comparisons, and a lot of texture comparisons (only a pointer compare, but I need to extract that texture pointer from each renderable object, and at 500,000 de-references per frame even that adds up.

Now granted this is all total worst case. Some of those 1,000 objects aren’t batchable, some of them *will* quit early as something overlaps, and when I do batch future ones with early ones, those future ones themselves don’t need to be checked as they have been optimized away.

The trouble is, after profiling, it is still about 70% slower for the CPU to do this, than not do it. The big problem here is that I’m making stuff light for the GPU, heavy on the CPU. Is that a good idea? maybe… But as it happens, if I assumed a dual core (or better) PC, it doesn’t matter because it is FREE. I have other threads just sat there. If I find a slot in my main loop between building the draw list and having to actually render from it, I can multi-thread that new slower batching code and actually have the whole app run faster, thanks to less draw calls later on. The Visual C++ concurrency profiler shows it works: (Click to enlarge)

visual_c++_concurrency_game

Previously I’d have gone through and built up the draw list (thats the blue), then done some particle drawing preparation(green), then batched my draw calls (purple) and then drawn everything (yellow). Because the particle stuff actually gets put into a different list, I can mess around with my slow batching in a new thread while the main thread prepares particle stuff. Hence the purple bar is now on a new thread and works alongside the main one. As it happens I also have 2 more threads doing some particle emitter stuff at the same time as well, so briefly I’m at 100% utilization on 4 threads, possibly 4 cores (other processes such as the music streaming/driver might be on one of them).

So in a sense, yay! faster code, but what a nightmare to measure. It depends on scene complexity, relative CPU/GPU speed, number of cores and god knows what else. However it is worth remembering that sometimes slower code will make your game run faster, it just depends where that slow code runs.

Finally realized I need to explain the core mechanics

Gratuitous Space Battles was a relatively big hit game (at least for positech), but it managed it despite some hilariously bad decisions. The lack of any decent explanation of how the core game mechanics work has to be one of them… For example the whole thing where some beam lasers bounced off shields, and some did damage, and you had no idea how or why probably upset some people. It was all explained in the manual, which obviously nobody read, because it looked like an RTS or an arcade game and thus such things aren’t necessary…bah.

The mechanics in GSB2 are slightly different, in that weapons have a fixed ‘damage’ but the effectiveness of that damage varies by hull/armor/shield. So a weapon might do 100 damage, at 50% if it goes straight to hull, 75% to armor, and 200% to shields. That makes it an awesome shield-hammering weapon, but not one you’d want to deliver the killer blow.

At least now a new part of the pop-up tutorial stuff does this:

shields

Which should at least mean a higher percentage of people pay attention to that stuff. Now I think about it, I should probably add some code that encourages weapons to select targets based on their effectiveness. ARGHHHHH.


Optimizing my gratuitous GUI

If you’ve watched high-def videos of Gratuitous Space Battles 2, or been lucky enough to try it at EGX, then you may have noticed all that gratuitous GUI fluff that animates and tweaks and flickers all over the place, because… frankly, I like that kinda nonsense, and it’s called GRATUITOUS, so I can get away with it. This sort of stuff…

widgets

Anyway…I love it,and it’s cool, but until today it was coded really badly. I had a bunch of helper functions to create these widgets, and I sprinkled them all over the GUI for fun. For example there was a function to add an animated horizontal bar that goes up and down. Wahey. Also there are functions to add random text boxes of stuff. The big problem is that each one was an isolated little widget that did it’s own thing. In the case of a simple progress bar widget, it would have a rectangle, and a flat-textured shaded box inside it that would animate. That meant 2 draw calls, one for the outline of the box (using a linelist) and the other was a 2-triangle trainglestrip which was the box inside it. That was 2 draw calls for a single animated progress bar thing, and a single GUI window might have 6 or even 20 widgets like that… so suddenly just adding a dialog box means an additional 40 draw calls.

Normally that doesn’t matter because a) 40 draw calls isn’t a lot, and b) graphics cards can handle it. However, it’s come to my attention that on some Intel integrated cards, which are actually surprisingly good at fill rate and general poly-drawing, too many draw calls really pisses them off, performance wise. Plus… 40 draw calls isn’t a lot, if thats your ‘thing’, but if there are 40 on the minimap, 40 on each score indicator, 40 on the comms readout, 40 on each of 3 ship inspector windows, then suddenly you have several hundred draw calls of GUI fluff, before you do the actual real GUI, let alone the big super-complex silly space battle, and yup…I’ve seen 4,000 draw calls in a frame. Ooops. To illustrate this, here is that top bunch of widgets in wireframe.

wire

That’s a lot of stuff being drawn just for fluff, so to ease the burden on lesser cards, I should be batching it all, and now I am. That used to be about ten trillion draw calls and now its about five. I have a new class which acts as a collection of all the widgets on a certain Z-level, and it goes through drawing each ‘type’ of them as it’s own list. Nothing actually draws itself any more, it just copies it’s verts to the global vertex buffer, and then when I need to, I actually do a DrawIndexedPrimitiveVB() call with all of them in one go.

Ironically, this all involves MORE verts than before, because whereas drawing a 12 pixel rectangle with a line list involves 4 verts, drawing it as a trianglelist uses loads more, but I’m betting (and it’s a very educated bet) that adding the odd dozen verts is totally and utterly offset by doing far, far fewer draw calls.

This is how I spend Sunday Afternoons when it’s too cold for archery…


THE GSB2 engine optimizing post

So Gratuitous Space Battles 2 is running really well (50-60FPS even at dual-monitor 5120 res mode) on my dev PC. dev PC specs:

win 7 64bit 8 GB RAM, i7-3770k CPU @ 3.50 GHZ. GeForce GTX 670.

However it can drip pretty low on my HD4000 intel laptop (also an i7, but lower spec). I’ve seen things go to 25 FPS at 1600×900, although that is without all the fancy options off, so maybe it will go higher with them deselected. Ideally I’d get that much better. So what is the problem?

I think it’s too many small draw calls, and sadly, thats kinda the way my engine works.

The basic algorithm of my engine is this:

Update_Everything() (game simulation, partly multithreaded)
Check_what_is_onscreen()
SetRenderTarget()
DrawBigListOfObjectsToRenderTarget()
SetRenderTarget()
DrawBigListOfObjectsToRenderTarget()
...
CompositeAllTheTargetsIntoFinalImage()
GUI()

The problem is all of those lists of objects being drawn. The solution to this in a conventional 3D game (before you all suggest it), is to use a z-buffer, sort all those objects by render state or texture or both, and blap them in a few draw calls. Thats fab, but it doesn’t work with alpha blending. People who do 3D games think alpha blending means particles, but nope, it also means nice fuzzy edges of complex sprite objects. To do the order-independent Z-buffer rendering method, you have to disable proper alpha-blending, and then everything starts to look sharp, boxy and ugly as hell. 3D games sprinkle antialiasing everywhere to try and cover it. With complex sprites layered on top of each other, this just looks dreadful.

The solution is the good old fashioned painters algorithm, meaning drawing in Z order from back to front. This works well and everything looks lovely.
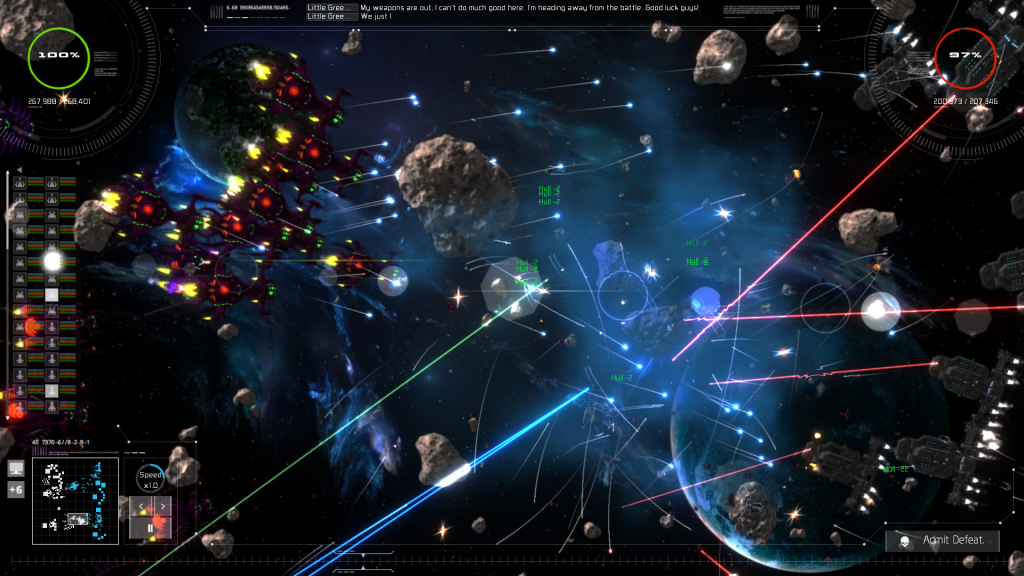
screen1

The problem is that you end up with 4,000 draw calls in a frame, and then  the HD4000 explodes. Why 4,000? well to get some of my more l33t effects I need to draw a lot of objects four times, so thats only really 1,000 objects. to do proper lighting on rotated objects I can’t group objects of a different rotation, so each angle of an identical object means a separate draw call. Some of my render targets let me draw regardless of that angle, but the problem then becomes textures. If you draw painters algorithm and draw this…

ShipA
ShipB
ShipA
ShipB

Then there is no way to group the ships by texture without screwing it up, if those ships overlap. This is “a pain”. There are some simple things I can do…and I have a system that does them. For example, if I have this big list of sprites to draw and it turns out that occasionally I *do* get ShipA,ShipA Then I identify that, and optimize away the second call by making a single VertexBuffer call for both sprites. (or both particle systems, in those cases) I even have a GUI that shows me when this happens….
engine1

The trouble is, the majority of the time this is NOT happening. There are to my mind two potential solutions, both of them horribly messy:

1) Go through the list  and calculate where I have a ‘ShipA….ShipA’ pair where there is nothing in between them that overlaps either of them, and then re-arrange them so that they are next to each other, thus allowing for a lot more grouping. (This involves some hellish sorting and overlap detection hell).

2) Pre-process everything, building up a database at the start of the rendering of which textures seem to naturally follow on from each other, then render those textures to a temporary ‘scratch’ render target atlas, which I can then index into. This would be fun to code, also amusing to watch the render target itself in the debugger :D Adds a lot of ‘changing texture pointers and UVs after the event’ complexity though.

Be aware that I’m using Direct9, mostly for compatibility reasons, which means that rendering to multiple render targets at once, or doing multithreaded rendering really isn’t an option.

Edit: just spotted a bug with method 2. If I draw 10 instances of ShipA, they may be at different Zooms, so I will only be caching (in my temp atlas) a single image, not the full mip-map chain, meaning the rendering of atlased sprites would lose effective neat mip-mapping and potentially look bad :(

Using Intels GPA Frame analyzer

I love tools like this. Click below. This is the intel GPA frame analyzer rendering a frame on my intel laptop, but me analyzing it remotely over the LAN from my main desktop :D

frame1