You might think that collecting data on how much energy your solar farm has generated would be a simple matter, where you have an app on your phone, or a website, with a single figure that was just easy to rely on and so on… Ha no. Obviously not. Everything is a billion times more complex when you go from the rooftop kilowatt-hour level to the grid-scale megawatt level.
There are THREE systems (oh yes) that are reporting the output data from the farm. We can call them the Solis, Orsis and Meter systems. Right now, I have data from two of them (although patchy) and the third one remains a mystery that I think I get access to through a third party, or maybe they just show up in the final invoices I get when I get the payment for the energy. Why are there three systems? surely its all one level right?
There are ten inverters on the site, each with up to 20 strings of solar panels. They are all made by Solis, but are different capacities, ranging from 80kw to 110kw in output. All of these inverters report their data, which as I recall is connected by actual physical cabling, running alongside the actual power cables, and all of that then gets connected to the big old wide interwebs using a router thats in our switchgear building. This means I can log into a portal either on my phone or a webpage on my desktop and read off the output of the whole site, or each inverter. The basic view looks like this:
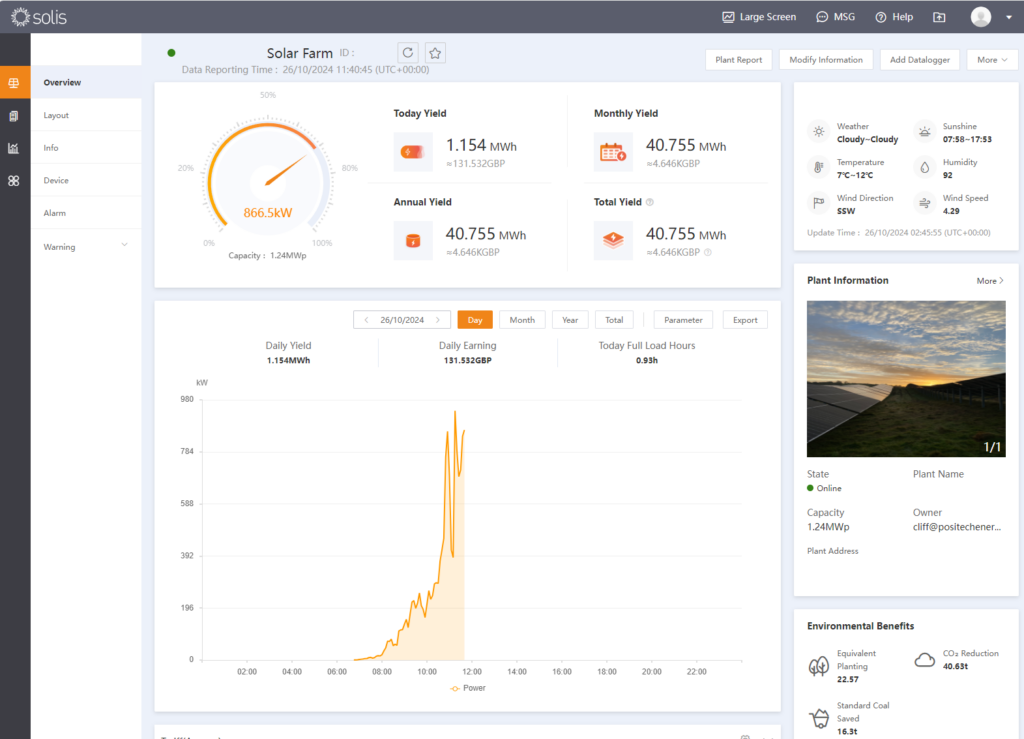
This is the data so far today, which is actually looking pretty good. Total output today is 1.154MWH. For those not familiar with the terms, that’s 1,154kwh. For perspective, a high-end electric car has a battery size of 80 kwh. You probably use between 10 and 20 kwh a day in a house this time of year in the UK, assuming no EV or heat pump. Late October in the UK is bad weather, and very far below peak output, so seeing these numbers is encouraging. We have been connected for about 3 weeks, but have had 2 days complete downtime, and a lot of rain, so 40.7MWH in that time is fairly good I think. You can look at stuff in much more technical detail:
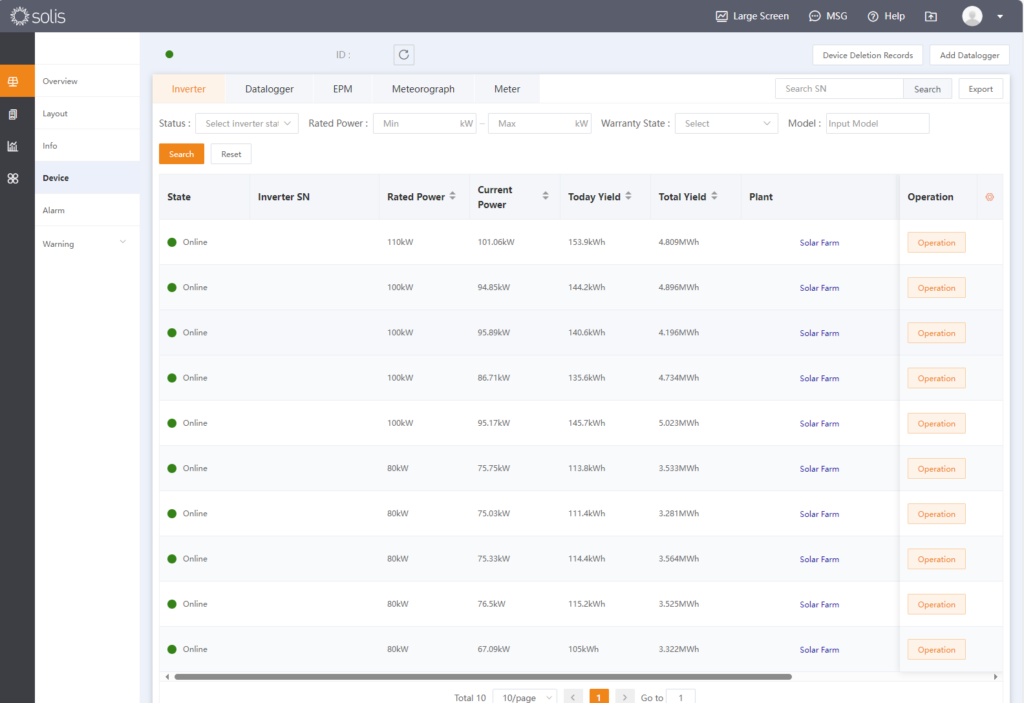
The yield figures differ for each inverter mostly because their capacities are different. I know people imagine a nice flat square field full of panels with a nice round 200 panels per inverter, all of which are identical…and oh how I wish this was the case for my farm too, but pretty much everything is slightly unusual about this site. (I was told by the developer that this was the hardest site they had done in ten years…just my luck!). Anyway, if you want to waste even more hours of your life, you can stare at stats for each inverter, which is pretty much there for fault-finding purposes but also kinda cool:
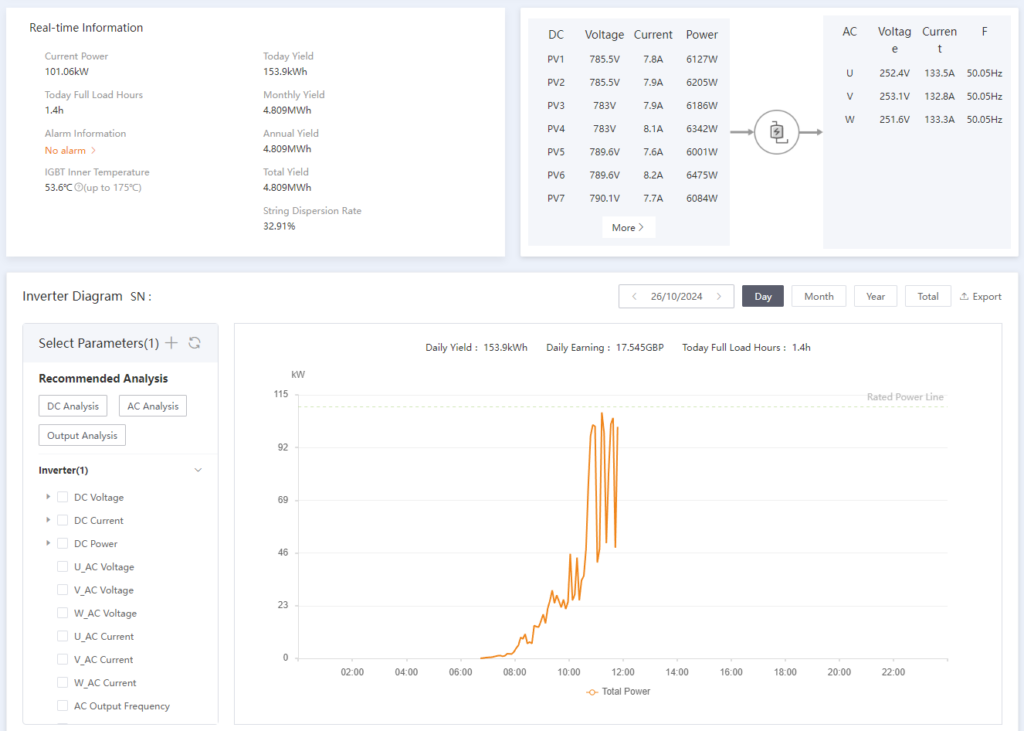
This is the screen where my geeky interest runs into the brick wall of me not being an electrician, but luckily other people also check this stuff, and the system will trigger alarms if something unusual happens, which would represent a cable breaking or a connector failing, or worst case, an inverter actually failing. Obviously right now it all works great :D.
Anyway…all of that is the inverter-level reporting, but thats not the ‘real’ output figure. There is also a site reporting system through a different portal (orsis) that is as far as I know, oblivious to the individual inverters and just looks at the combined power flowing out of the system. Thats also got a web portal. It might have an app too, I have not searched for that yet. Already most of my phone home screen is various solar/battery/farm/ev reporting apps :D. Here is the basic orsis view:
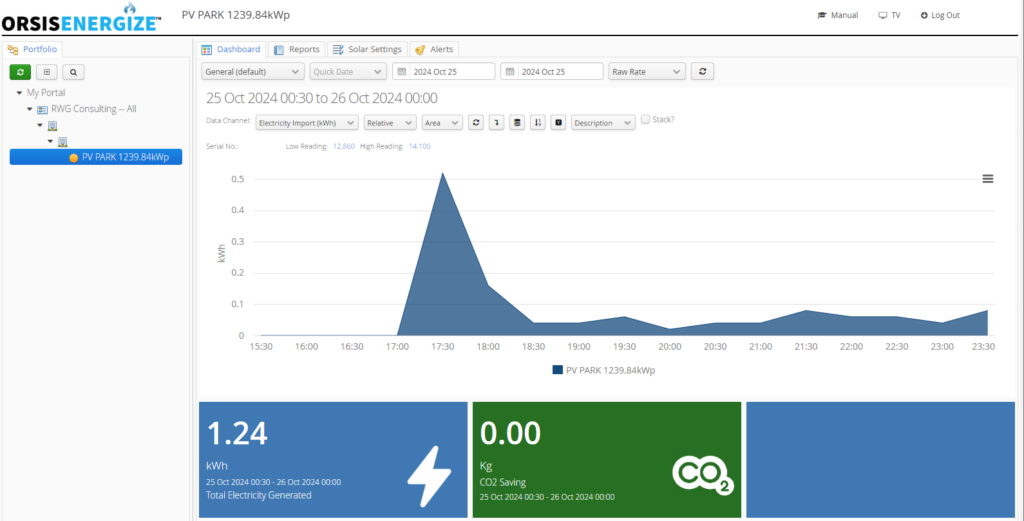
In comparison this reporting seems kinda rubbish, and it seems to not show the current day at all. It relies on a modem (WTF is a modem these days?) to send out data. TBH the whole UI for this system has a sort of ‘coded in 1990’ vibe to it. Maybe they need to hire a game designer with extensive experience of flashy data-visualization to do a new front end :D.
But hold on, I mentioned three systems right? Well there is a meter on the site that is remotely read by a special company, which is called a meter operator. It might seem ridiculous to need yet another service to just read a simple string of digits, but its worse. You also need to have a data collector and a data aggregator. These three different names for basically the same thing (reading about 1k of data a day) are how the insane fees that get charged are justified. In a sane world, some big tech company like Microsoft or Google would handle this sort of thing for a flat fee of $9.99 a year. Unfortunately this is not the case…
So anyway, as I understand it, that meter gets read remotely and the data from it passed by the Meter Operator (MO)/Data Collector(DC)/Data Aggregator(DA) to the buyer set out in the Power Purchase Agreement (PPA), and then I get sent some money.
Eventually.
Hopefully.
If I had £1 for every energy company acronym I have encountered I wouldn’t need a solar farm. There is then all the excitement of applying for, and getting accredited for the REGOs (Renewable Energy Guarantee of Origin), which always takes MONTHS and has a level of bureaucracy that would make a Tax collector blush. I hope to have all the information I need to finalize my application for that within a few weeks at most. Obviously you cannot pre-apply, because that would be efficient.
Anyway, I am currently in solar-stats-heaven. I was musing about buying some nano-leaf programmable RGB light blocks for my office wall to connect to the solar output from the farm. It seems like an SDK for the blocks is all very easy, but I would need to learn how to code some system to log into the web portals and periodically scrape the data. I probably cannot be bothered :D.