My Excel skills have levelled up since I last wrote about balancing production line using player statistics. As a result I now have more informative charts to look at when analysing play sessions from build 1.32. My intentions with this balancing are to increase the long term playability and balance of the game. basically player retention is good after 1 day, good after 7 days, but starts to tail off before 28 days, implying that the game is good initially but loses its challenge after a while. it may also suggest a lack of content, which is surprising given what’s in the game, but will be naturally fixed over time as more is added (Pickup trucks, quality control, branding, breakdowns).
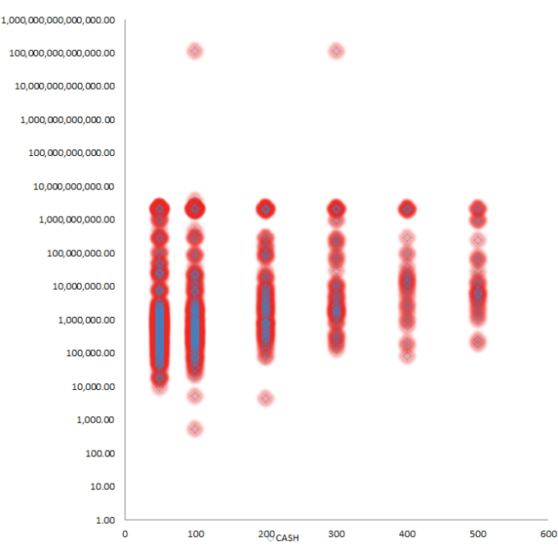
Looking at the following chart I can see that the amount of cash players have after 50,200,200,300…500 hours. I’m quite happy with this. clearly the amount climbs over time, but is not exorbitant for the median player. I’d like the player to have the odd million dollars in cash, but beyond 10 million makes things a bit easy. Hopefully some expensive upgrades for luxury cars in the late game will push that down slightly.

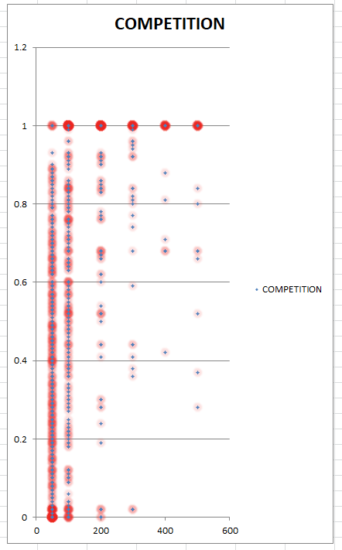
This second chart shows the intensity of AI competition, and is basically a measure of how well the player is doing, as perceived by the AI. I can see that I was absolutely right to do away with the 50-hour moratorium of AI competitors, as clearly some players race ahead and needed to have the AI rein them in. The clear problem here is that the competition value is trending rapidly up to 100%. I feel that this is a strong indicator that the maximum competitive level of the AI just is not competitive enough. In other words, the metrics by which the AI judges the player are not being bought under control by the methods available to the AI. This needs fixing.

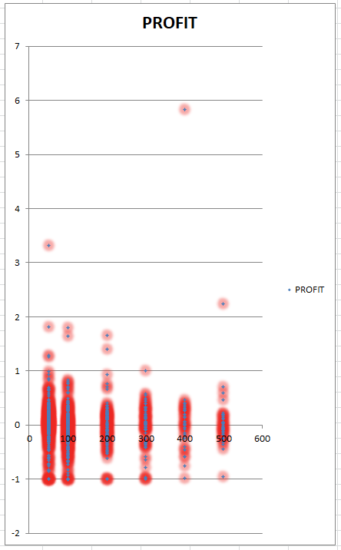
This final graph shows the profitability (as percentage margin) of the players business over time. Its not unreasonable for this to be low, even at a loss during the start, as the player invests in equipment and ramps up production. Over time this is trending to slightly above zero, and my raw stats show an average value at 500 hours of 7.2%. This isn’t too bad, certainly believable in an industry like car production. I dont see that anything really needs to change is response to this graph.

So my conclusions from the currently available data is that the competition index metric is too meek, and that the player should face potentially more challenging AI at the top end, but at the bottom end, it should definitely continue to act as before, taking its foot off the metaphorical gas pedal of competition. The AI seems ok at not crushing the poor-performing player, but too weak to offer a decent challenge to the high-performing one.
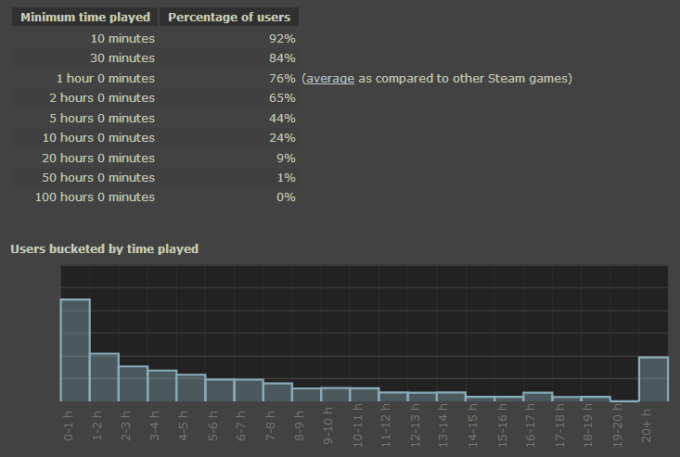
Of course the important thing here is to work out what my ideal metrics are for improving the game. I’m assuming that people only continue to play games that they enjoy, and thus the hours played of the game should be a decent metric to show whether or not the game is getting more fun. Right now those stats look like this:

Which isn’t too shabby. I compared it with another one of my games and this isn’t too bad, especially considering the much shorter time its been out, and the fact that it is not content complete. Ideally you dont just make a game for those hardcore who put in 20+ hours but try to move everyone along that graph. I’d like to see the number of people playing 2 hours go up a lot more. I think if you don’t like a game you find out before then, so that’s a sign I’ve made something enjoyable. To that end, I need to ensure the game remains challenging in the long run, so tweaking these figures should hopefully nudge it in the right direction.
I feel I should do some actual marketing fluff here, so if you like the sound of the game and haven’t bought it, here is a link :D