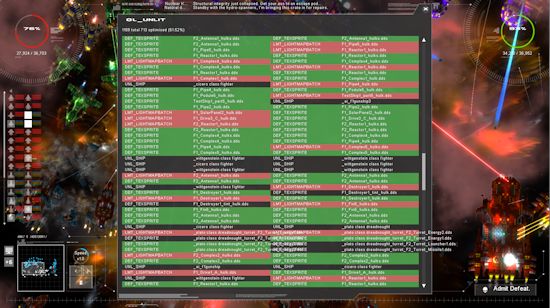
Background: I use directx9 to develop Gratuitous Space Battles 2 using my own engine.
I’ve been doing my best to reduce the number of draw calls per frame for complex scenes in GSB2. Basically I have a lot of stuff with different textures and render states, and they are being drawn from front to back rather than z-buffer sorted (for reasons concerning sprites & high quality alpha blended edges). What this means is, when you have 16 identical laser beam turrets, you may not be able to draw them as a single batch, because in-between them you might be drawing other stuff. As a result you get 16 draws instead of one. Ouch. That causes driver slowdown, directx slowdown, and inefficiency on the GPU, which prefers big batches.
Of course you can immediately see that it would be fine to go through the draw list (one of several actually, for composition reasons), and spot all those cases where you have 2 or more turrets (or any sprite) that use the same texture and which do NOT have anything in between them that overlaps the first one, and grab that second turret and draw it ‘early’ with the other one. And in fact, that works just fine. suddenly lots of draw calls get optimized away! (the green ones) In this case out 1,159 draw calls 713 get optimized away into batches.
 There is an immediate problem though. This is extremely slow, even with every optimization trick in the book. Assume you have a list of 1,000 objects to draw (not inconceivable for big battles). In the worst case situation, that means comparing object 1 to 999 different others and doing a bounds check. Then object 2 gets compared to 998, then 3 to 997, and so on. That is a LOT of function calls (inlineable I know…), and a lot of bounding box comparisons, and a lot of texture comparisons (only a pointer compare, but I need to extract that texture pointer from each renderable object, and at 500,000 de-references per frame even that adds up.
Now granted this is all total worst case. Some of those 1,000 objects aren’t batchable, some of them *will* quit early as something overlaps, and when I do batch future ones with early ones, those future ones themselves don’t need to be checked as they have been optimized away.
The trouble is, after profiling, it is still about 70% slower for the CPU to do this, than not do it. The big problem here is that I’m making stuff light for the GPU, heavy on the CPU. Is that a good idea? maybe… But as it happens, if I assumed a dual core (or better) PC, it doesn’t matter because it is FREE. I have other threads just sat there. If I find a slot in my main loop between building the draw list and having to actually render from it, I can multi-thread that new slower batching code and actually have the whole app run faster, thanks to less draw calls later on. The Visual C++ concurrency profiler shows it works: (Click to enlarge)

Previously I’d have gone through and built up the draw list (thats the blue), then done some particle drawing preparation(green), then batched my draw calls (purple) and then drawn everything (yellow). Because the particle stuff actually gets put into a different list, I can mess around with my slow batching in a new thread while the main thread prepares particle stuff. Hence the purple bar is now on a new thread and works alongside the main one. As it happens I also have 2 more threads doing some particle emitter stuff at the same time as well, so briefly I’m at 100% utilization on 4 threads, possibly 4 cores (other processes such as the music streaming/driver might be on one of them).
So in a sense, yay! faster code, but what a nightmare to measure. It depends on scene complexity, relative CPU/GPU speed, number of cores and god knows what else. However it is worth remembering that sometimes slower code will make your game run faster, it just depends where that slow code runs.